Delhi to Vienna, the Long Way Round
When conflict escalated across the Middle East in late February 2026, airspace closures followed rapidly. NOTAMs were issued, but at short notice, and the scope kept expanding. Within days, large swathes of Middle Eastern airspace — not just Iran, but multiple FIRs across the region — were closed to commercial overflights. Hundreds of daily flights between South Asia and Europe that normally transit these corridors had to find alternate routing. As a pilot, this is the kind of scenario you train for in theory but rarely witness at this scale. As an engineer, it is a dataset waiting to be captured.
I started tracking Air India flight AI153, a Boeing 787-8 operating Delhi to Vienna, using publicly available ADS-B data from FlightAware’s AeroAPI. The goal was straightforward: capture the actual tracks flown before, during, and after the closures, and study how airline operations adapted.
The normal route
On February 26, two days before the conflict began, AI153 flew what had been its standard routing for years. Out of Delhi heading southwest through Rajasthan, down to the Makran coast of Pakistan, then turning north through the Oman-UAE corridor into the Persian Gulf region. From there, northwest across Iraq and into Turkish airspace, then through the Balkans into Vienna. About 755 ADS-B position reports trace a clean, efficient path — the kind of routing you would expect on a mature long-haul sector.
The aircraft reached a northernmost latitude of around 48°N at Vienna, with the route’s critical transit through the Gulf region clearly visible around 29°N, 48°E. This corridor through the Middle East is the backbone of traffic between South Asia and Europe.
February 28 — airborne when it started
The February 28 flight is where the data gets interesting. War broke out that day, and AI153 was already airborne. The track shows the initial departure from Delhi following the same familiar southwest heading through Rajasthan and down to the Pakistani coast. The first half of the route looks identical to the February 26 flight.
But then the divergence. Instead of turning north through the Gulf corridor, the aircraft stayed south. At around 22°N latitude, it continued westward across the full width of the Arabian Peninsula, maintaining a low latitude all the way from 60°E to 38°E. It then turned north up the Red Sea, transited Egypt, crossed the Mediterranean, and worked its way through the Balkans into Vienna from the southeast.
736 ADS-B points tell the story of a flight that started on one routing and finished on another. Whether the crew received updated routing before departure or were re-cleared en route, the track captures the exact moment an airline’s operational planning collided with a changing geopolitical reality.
March 3 — the new normal
By March 3, the closures were well established and there was no ambiguity. AI153 departed Delhi heading southwest and committed to the southern detour from the start. Across Rajasthan, down to the Makran coast, westward across Arabia at low latitude, up the Red Sea, through Egypt, across the Mediterranean, through the Balkans, and into Vienna. 798 position reports trace what had become the standard alternate routing.
The numbers tell a clear story. What was roughly 5,800 km through the Middle Eastern corridor became approximately 7,600 km via the southern route. About 7 hours became about 9. On a 787-8, that is somewhere between 8 and 12 tonnes of additional jet fuel — per flight, per day.
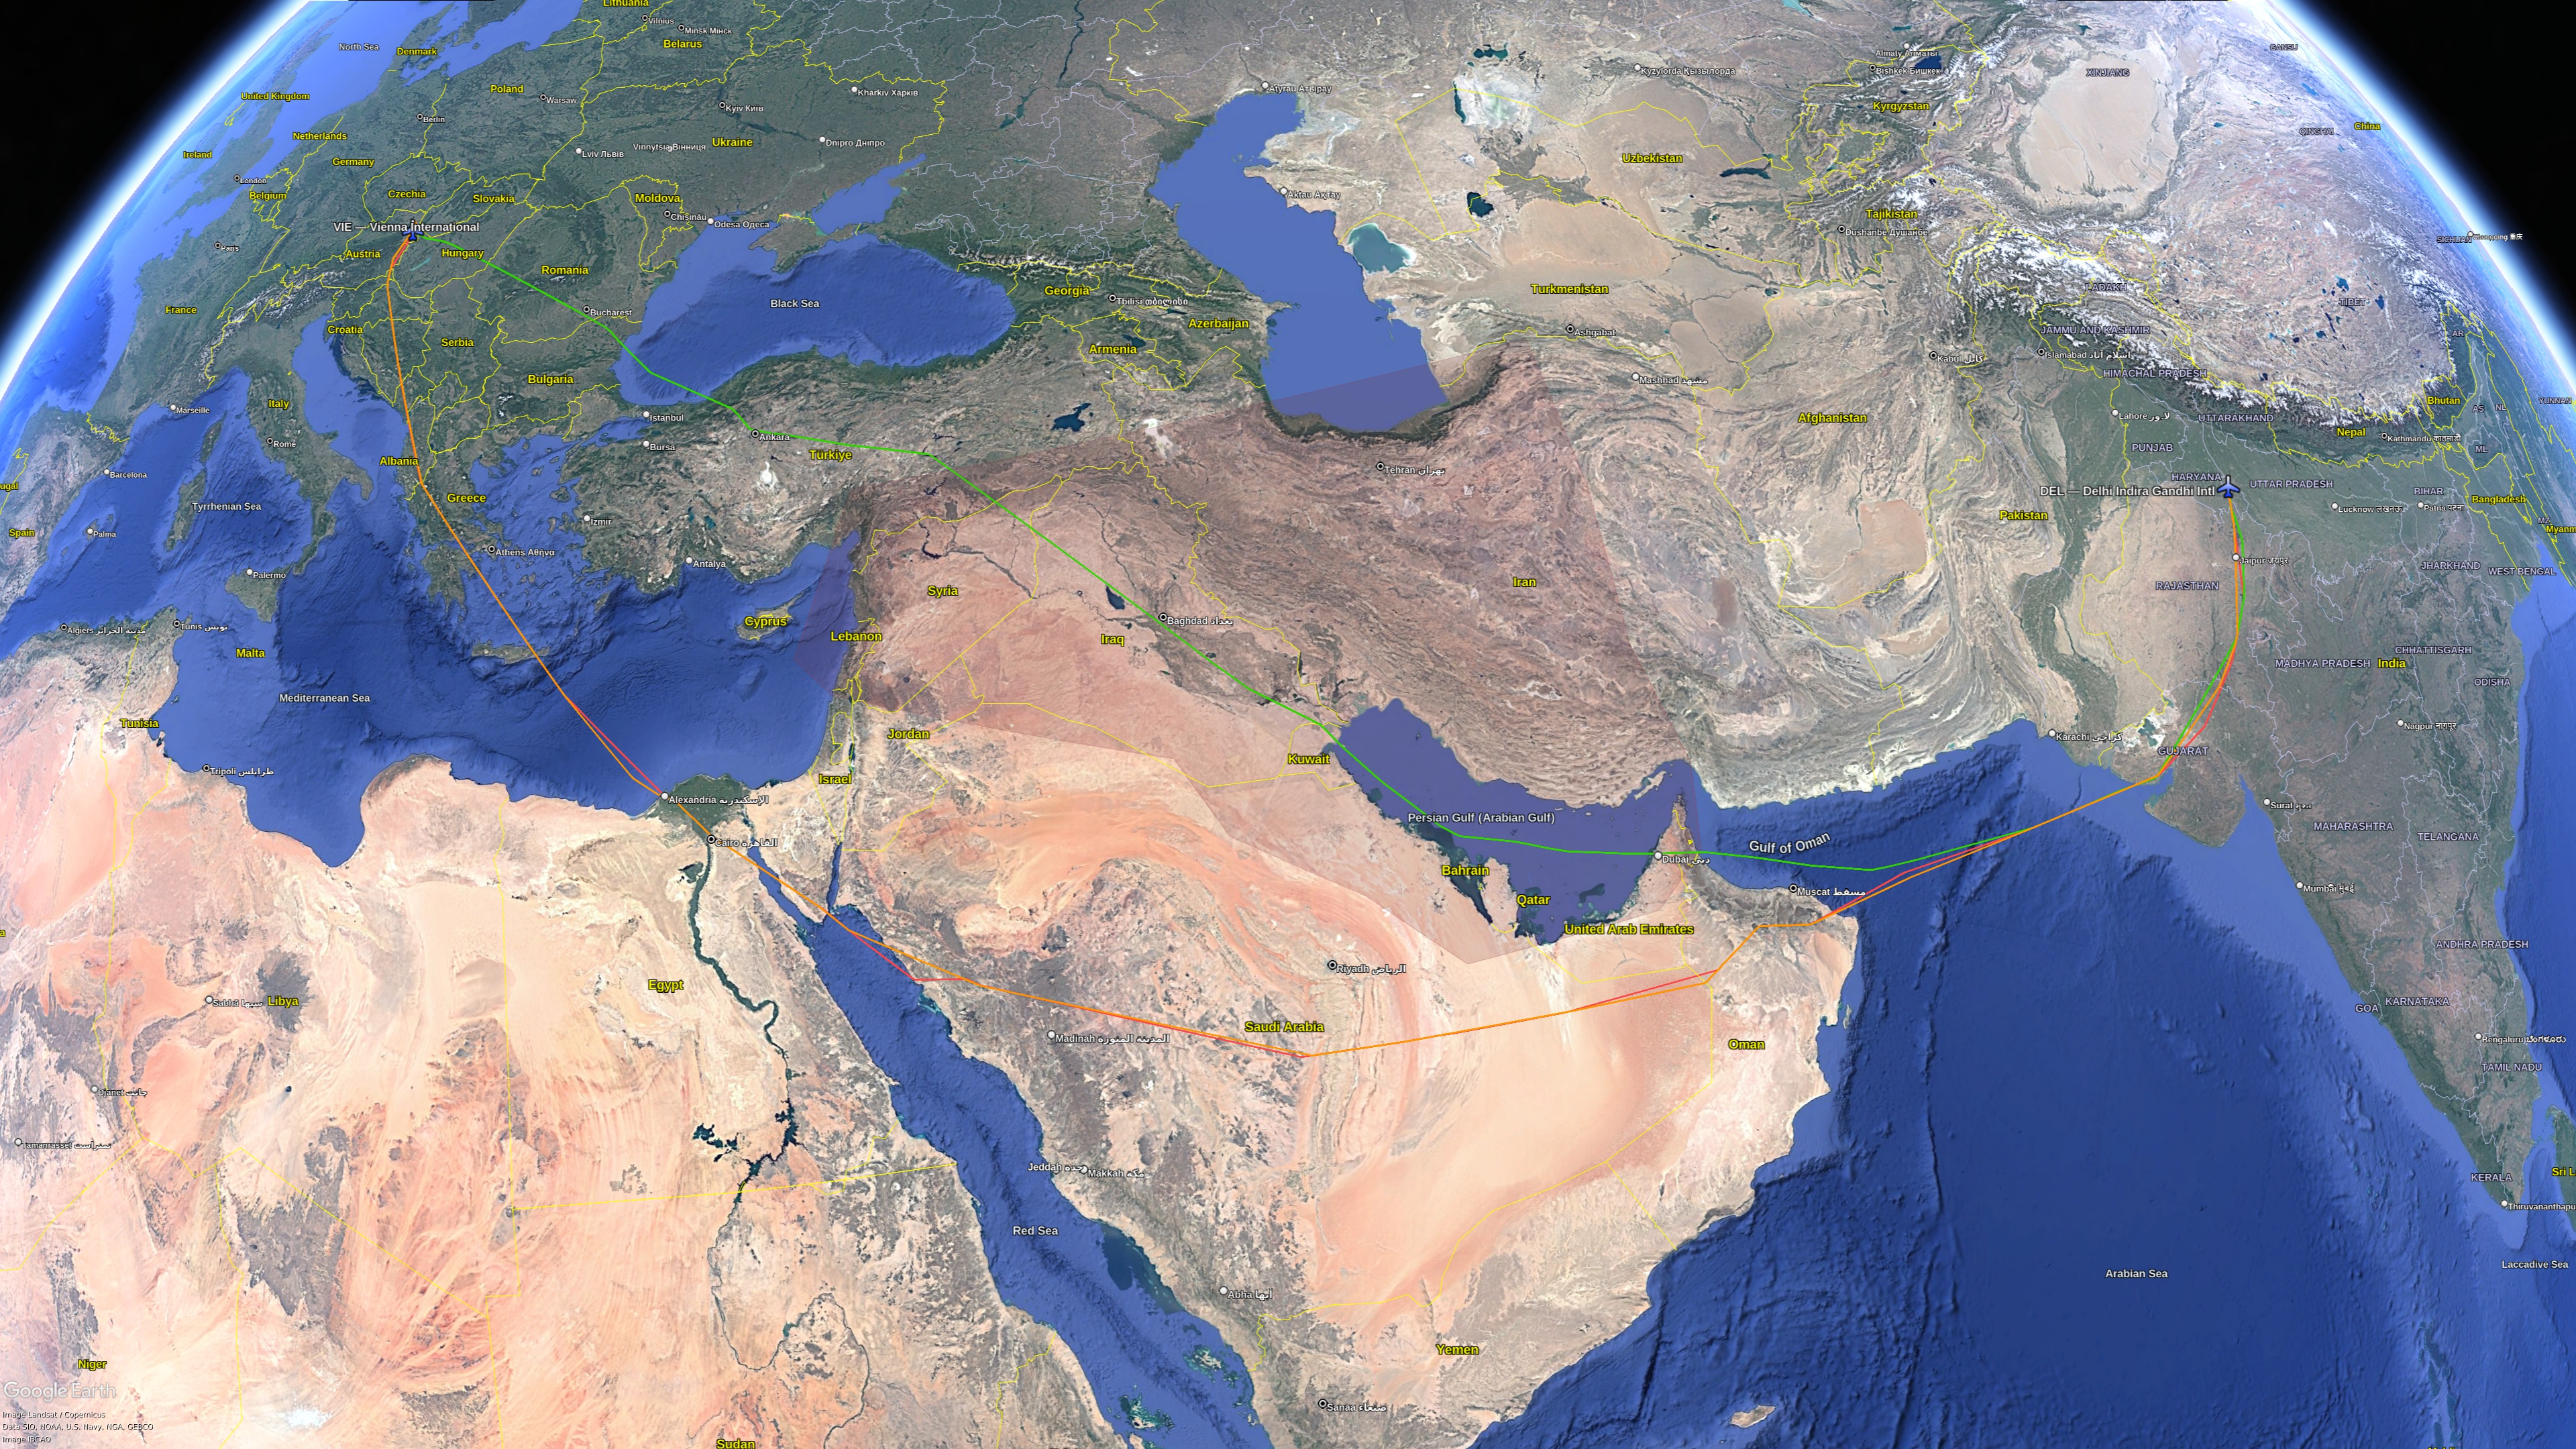
Three tracks, one picture
Overlaying these three tracks on a map makes the operational impact immediately visible. The February 26 route arcs north through the Gulf and Turkey. The February 28 route starts the same way but bends south mid-journey. The March 3 route commits to the southern detour from departure. Three flights, three weeks, and you can see an airline’s entire operational response to an airspace closure in the shape of the lines.
The Middle Eastern corridor does not just serve Indian carriers going to Europe. It handles traffic from Southeast Asia, East Africa, and the Gulf states. When it closes, the alternate routes through southern Arabian airspace and Egyptian corridors absorb the overflow, creating congestion in airspaces not designed for that volume.
Why ADS-B matters here
To be clear — by March 3, none of this was a surprise. The airspace closures were known, NOTAMs were published, and airlines had already updated their flight plans. ADS-B data did not reveal something the industry did not already know.
What ADS-B data does offer is a precise, independently verifiable record of how airlines actually responded. Official NOTAMs tell you what airspace is closed. Airline schedules tell you what was planned. But ADS-B tracks show you what actually happened — the exact routing, the fuel-burning detours, the convergence of traffic onto alternate corridors. It is the ground truth.
I built a lightweight tracking tool using Python and Leaflet to capture and visualise these tracks day over day. No dependencies beyond the standard library. The AeroAPI integration is interactive and manually triggered to keep API costs controlled — 2 calls per track fetch, with a daily budget cap. Each day’s track gets injected into a comparison map, so routing changes over time become immediately visible.
What this is really about
This is not about one flight or one airline. It is about how quickly operational reality shifts when geopolitics changes the map, and how open data lets us observe and document those shifts precisely. Airlines are making significant routing decisions daily — decisions with real fuel burn, schedule, and crew implications — and the evidence is sitting in publicly available ADS-B feeds for anyone paying attention.
The intersection of aviation operations and data engineering is where I find the most interesting problems. This project sits exactly there.